Announcement

Collapse
No announcement yet.

Season 5 Ratings thread

Collapse
This topic is closed.
X
X
 
  • Filter
  • Time
  • Show
Clear All
new posts

    Originally posted by Briangate78 View Post
    Well some people do. The chart is also off because just because a show 3 years ago got a 1.5, it might not hold the weight of a show that gets a 1.5 today. It is almost saying that four years ago 4quarters equals a dollar, and today 3 quarters also equals a dollar.

    I would love to see a viewer total chart. I just wish people did not compare ratings points. The finale of both Sanctuary and SGA is a perfect example. Sanctuary got a 1.6, SGA got a 1.5, but yet had around 20,000 more viewers than Sanctuary.
    Why don't you make one for us then.

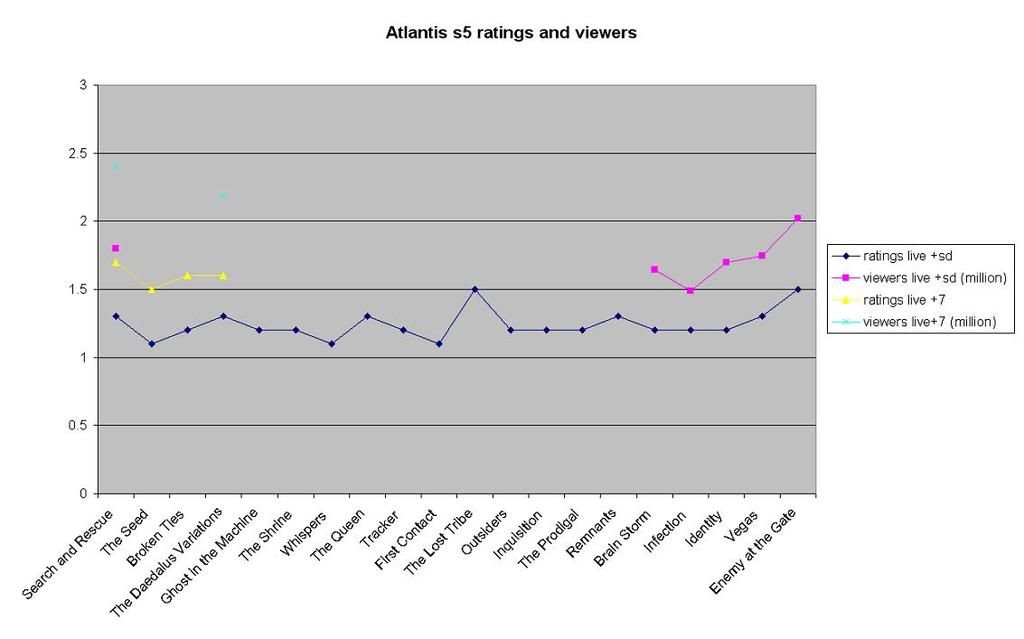
    Or post the viewer numbers for all the eps and I'm sure someone would love to make a chart for you. Not me though.
    IMO always implied.

    Comment


      Originally posted by Briangate78 View Post
      Well some people do. The chart is also off because just because a show 3 years ago got a 1.5, it might not hold the weight of a show that gets a 1.5 today. It is almost saying that four years ago 4quarters equals a dollar, and today 3 quarters also equals a dollar.

      I would love to see a viewer total chart. I just wish people did not compare ratings points. The finale of both Sanctuary and SGA is a perfect example. Sanctuary got a 1.6, SGA got a 1.5, but yet had around 20,000 more viewers than Sanctuary.
      It may be the viewer numbers remained static (which is what the chart actually does tell me), but you still can not add Live+7 to only the last 20 episodes because that completely ignores the minor fact that people DVRed/recorded the show before this season.

      If you can add 0.3 to this season you can also do so to last season (I think that's the number we found for S4) and probably the seasons before. Which means the movement of the graph remains the same.

      I could give you a good guess that the total viewer chart has probably looked like this for 4-ish seasons:

      ------------------------------------------------

      Which, believe it or not, is actually not a great thing to have since it means that, no matter what changes they make to it, the show is not appealing to a anyone but those currently watching while becoming more and more expensive to make. Nobody else is interested in giving it a chance.

      I understand you are a massive fan of the show, but you are picking and choosing which numbers to read every year in order to justify what you are saying. If a dollar is now 5 quarters I expect you wouldn't think to mention that previously it was 4 quarters, because you are a fan.
      Still, the graph is not wrong just because you don't like the answer.

      Comment


        Originally posted by smurf View Post
        It may be the viewer numbers remained static (which is what the chart actually does tell me), but you still can not add Live+7 to only the last 20 episodes because that completely ignores the minor fact that people DVRed/recorded the show before this season.

        If you can add 0.3 to this season you can also do so to last season (I think that's the number we found for S4) and probably the seasons before. Which means the movement of the graph remains the same.

        I could give you a good guess that the total viewer chart has probably looked like this for 4-ish seasons:

        ------------------------------------------------

        Which, believe it or not, is actually not a great thing to have since it means that, no matter what changes they make to it, the show is not appealing to a anyone but those currently watching while becoming more and more expensive to make. Nobody else is interested in giving it a chance.

        I understand you are a massive fan of the show, but you are picking and choosing which numbers to read every year in order to justify what you are saying. If a dollar is now 5 quarters I expect you wouldn't think to mention that previously it was 4 quarters, because you are a fan.
        Still, the graph is not wrong just because you don't like the answer.
        Huh? Live+7 has been counted since 2006, when Season 3 was airing. We do have a fair comparison.

        Looking it at an advertiser point of view, you have to understand that the networks were looking at live raw for the main part, now its C3. C3 has put shows like SGA and BSG to name a few at their Live+SD or even better.

        As per the massive fan part. I am just trying to explain how things work. Ratings are more complex than a ratings point you see on SCI FI wire.
        sigpic

        Comment


          Originally posted by Briangate78 View Post
          Huh? Live+7 has been counted since 2006, when Season 3 was airing. We do have a fair comparison.

          Looking it at an advertiser point of view, you have to understand that the networks were looking at live raw for the main part, now its C3. C3 has put shows like SGA and BSG to name a few at their Live+SD or even better.

          As per the massive fan part. I am just trying to explain how things work. Ratings are more complex than a ratings point you see on SCI FI wire.
          Yes, a fair comparison with other Live+7 not when put against previous seasons' Live+SD - which you seem to be suggesting someone do to Jenks' graph.
          The advertisers care about the Live data (and now the C3s - which in most part are near as dammit the same as the Live+SD), so why make a fuss about the Live+7.

          There is explaining how things work, and being misleading/confusing by mixing methodologies.


          --

          Here's a funny thing, I was going to post some yadda about Sci Fi's increased reach over the time of SGA's run causing the drop in ratings while the viewership remained static, but I was distracted by the thought:

          What happens if I put the viewers/rating numbers of SGA's finale (2.02 million = 1.5 rating) into any of the previous seasons' available viewers=ratings numbers?

          So I tried it on SGA's premiere episode (4.2 million = 3.2 rating). Now, I had a certain expectation of what rating I'd end up with given that Sci Fi's reach had grown in 3 years (2005-2008) from less than 74 million to 93 million households - or with, say an average of 2 viewers per household, a potential audience increase of 38 million people.
          Guess what number came back?


          A rating of 3.12.

          Seriously, I was amazed. I tried it on other episodes as well - numbers from GW:
          S1 "Home" 2.3 million viewers. At the time this equalled a 1.7 rating, using SGA's finale numbers it's a 1.71 rating.
          S3 "First Strike" 2 million viewers. At the time 1.5, now 1.48.
          S4 "Adrift" 1.7 million viewers. Then 1.2, now 1.26.
          S5 "Search & Rescue" 1.8 million viewers. Then 1.3, now 1.34.

          Which means the whole "ratings from three years ago don't hold the same weight" argument leaks like an old shoe. The difference is almost negligible.

          Yes, I'm still amazed.
          [geek]For the mathematically minded: 2,020,000/1.5=1,346,666.66(recurring) viewers per ratings point. 4,200,000/1,346,666.66= 3.12 rating.[/geek]
          Last edited by smurf; 25 January 2009, 04:38 PM.

          Comment


            Originally posted by smurf View Post

            There is explaining how things work, and being misleading/confusing by mixing methodologies.

            I am not misleading or confusing methodologies. You have to consider that the V.P.H is always changing so you cannot take one ep and compare it to another ep. You have to compare season averages. This is what I have got with all Live+7 data from the last 3 seasons...

            Season 3 - 1.5 (1.9 Million viewers)
            Season 4 - 1.4 (2.0 Million viewers)
            Season 5 - 1.6 (2.1 Million viewers)

            Season 2 had a 1.9 HH with approx 2.2 Million viewers but that was Live+Sd,Live + 7 was not out yet. Even if Live+7 was out back then it would of likely not have moved that number too much anyway to make a significant change.

            Live+7 is what you call the gloating rights. It's fluff, but at least we can nip the old "SGA is losing viewers" myth in the butt. Because they are not losing viewers, but rather viewers are watching at different times. That was proved last year. The live numbers are even up for SGA. The last half squeezed in a 1.3 HH rating, the best since Season 3.0 (First half of S3 Average)!

            Anyway, I am done with this topic, for now. Seriously, there are so many other things to worry about than a ratings graph for a show that is never coming back as a TV series. I should of not said anything and not even say a word to Jenks. Because his graph is correct for Live+SD, but with some eps increasing as much as a half of a rating point for live +7 this season, I felt i needed to bring up the issue.

            I am going to ask you to stop saying I am misleading people. Because I am not. That to me makes this conversation more personal. I've done a lot of research with ratings, have talked to many people in the TV/Ratings industry and even have talked to network people as well. So I am not just making stuff up to make SGA look good. I know the show for their last 3 seasons did not do as well as the first and maybe even the 2nd. But the show did rebound after a dip, that to me shows a lot about a show holding it's water and even finding new viewers. The show could of went at least another season, but MGM had other plans.
            Last edited by Briangate78; 25 January 2009, 08:44 PM.
            sigpic

            Comment


              Originally posted by Briangate78 View Post
              I am not misleading or confusing methodologies. You have to consider that the V.P.H is always changing so you cannot take one ep and compare it to another ep. You have to compare season averages. This is what I have got with all Live+7 data from the last 3 seasons...
              Spoiler:


              Season 3 - 1.5 (1.9 Million viewers)
              Season 4 - 1.4 (2.0 Million viewers)
              Season 5 - 1.6 (2.1 Million viewers)

              Season 2 had a 1.9 HH with approx 2.2 Million viewers but that was Live+Sd,Live + 7 was not out yet. Even if Live+7 was out back then it would of likely not have moved that number too much anyway to make a significant change.

              Live+7 is what you call the gloating rights. It's fluff, but at least we can nip the old "SGA is losing viewers" myth in the butt. Because they are not losing viewers, but rather viewers are watching at different times. That was proved last year. The live numbers are even up for SGA. The last half squeezed in a 1.3 HH rating, the best since Season 3.0 (First half of S3 Average)!

              Anyway, I am done with this topic, for now. Seriously, there are so many other things to worry about than a ratings graph for a show that is never coming back as a TV series. I should of not said anything and not even say a word to Jenks. Because his graph is correct for Live+SD, but with some eps increasing as much as a half of a rating point for live +7 this season, I felt i needed to bring up the issue.

              I am going to ask you to stop saying I am misleading people. Because I am not. That to me makes this conversation more personal. I've done a lot of research with ratings, have talked to many people in the TV/Ratings industry and even have talked to network people as well. So I am not just making stuff up to make SGA look good. I know the show for their last 3 seasons did not do as well as the first and maybe even the 2nd. But the show did rebound after a dip, that to me shows a lot about a show holding it's water and even finding new viewers. The show could of went at least another season, but MGM had other plans.
              If you completely missed the majority of my post: In five years, the V.P.H has not changed by any great amount. It's amazing but that's what the numbers say. Essentially, for all the increase in cable growth, a smaller percentage of people are watching television.
              This is what the major networks are having problems with, but cable has, so far, been protected from. Cable is running fast enough to stand still.

              I felt you were being misleading by mentioning that the last 20 episodes should have the 0.3 Live+7 added. If you had mentioned that on the whole you could increase the numbers by 0.3 then there would be no problem. (That's the point I'm making which I notice you keep cutting out of my reply ) It's not a personal thing, I don't think you were doing it deliberately, but the wording of the post uses a confusing mix of methodologies for those not in the know which I think is important to acknowledge when dealing with facts.

              At most you could say is that, as someone who has come to be seen as the arbiter of knowledge regarding the ratings, I expect you to hold to a higher standard than other posters. Your, or MediaSavant's, opinion holds more weight for posters who aren't greatly interested in ratings, so saying a graph is "off" when it isn't is something I - someone who geeks math, and understands ratings - feel needs clarification.

              I won't argue against SGA squeezing in another season if MGM had wanted it - SGA should be applauded for managing to keep pace with what cable viewer growth there was - but I will argue against trying to make one season appear greater than it is by suggesting we add counting method B into a graph of counting method A.

              Especially since my calculations above show the ratings actually did go up. No wonder Sci Fi were happy.

              Comment


                Still no rating # for Vegas?
                Chicago Con Attendee 2011
                Chicago Con Attendee 2010
                GateCon Attendee 2008
                Vancouver Con Attendee 2007

                Comment


                  Originally posted by pisces27 View Post
                  Still no rating # for Vegas?
                  1.3 for live +sd, 1.743 million viewers
                  Spoiler:
                  sigpic
                  The Sam Carter/Amanda Tapping Thunk thread The Sam/RepliCarter Ship Thread

                  Comment


                    Originally posted by Jumper_One View Post
                    1.3 for live +sd, 1.743 million viewers
                    Spoiler:
                    Thank you!
                    Chicago Con Attendee 2011
                    Chicago Con Attendee 2010
                    GateCon Attendee 2008
                    Vancouver Con Attendee 2007

                    Comment


                      Lcshepp writes: “Joe, has there been any word on the ratings for ‘Vegas’ and ‘EATG’?”

                      Answer: Early numbers had Vegas doing a 1.3, Enemy at the Gate a 1.54
                      http://josephmallozzi.wordpress.com/...d-the-mailbag/
                      sigpic
                      The Sam Carter/Amanda Tapping Thunk thread The Sam/RepliCarter Ship Thread

                      Comment

                      Working...
                      X